 |
| Figure 1. The inevitable effect of vaccinations on blood levels of Vitamin D. The green line illustrates someone who has a good blood level of Vitamin D. The blue line represents some who initially has a low blood level of Vitamin D. Without Vitamin D supplement, vaccinations will damage Vitamin D mediated immunity. (see previous Blog post for further details) |
In this Blog post there are many Figures and a lot of numbers. The important points are in the text, which I hope can be read easily. The details in the Figures are for reference so as to demonstrate that the data are real.
My previous Blog post looked at data from the Public Health Agency Canada, PLAC. I identified that during the week April 10 to April 17 2022, there were 277 Covid-19 deaths. This is calculated by the total cumulative number on April 17 (16,002) minus the total cumulative number recorded on April 10 (15,775). Of the 277 deaths, 276 had received at least one vaccination and only one had not been vaccinated.
This might appear to be too extreme. Could it really be true? I was doubtful but when I analysed the data the numbers were real and they were published in official documents. Was this week somehow exceptional? What about other weeks?
The problem is that each weekly report by the PHAC is an update of the previous week, starting in December 2020. At that time all of the Covid-19 deaths were obviously in the unvaccinated, and during most of 2021 the majority would have been unvaccinated. It would be only at the end of 2021 that first people would be triple vaccinated, that is "fully vaccinated (x2) plus additional (booster)". But the historic data are not of relevance at present, as it is "now" that is important to us.
We can subtract last week's cumulative data from this week's (always a larger number), but I am unable to identify data from previous weeks as previous data is contunally over-written. However by taking screen-shots each week it is possible to look at each week prospectively.
I described additional data from May 1st, two weeks data being identified by subtraction of April 17th and then averaged into two separate weeks. I can now display the data reports from May 8th, May 15th, and May 22nd a total of six weeks.
Recent updates of Covid-19 deaths in Canada
From the official PHA Canada reports I can display Table 2 of the two most recent updates.
Data from May 8th
 |
| Figure 2. Data from May 8th 2022 |
Data from May 15th
 |
| Figure 3. Data from May 15th 2022 |
Data from May 22nd
 |
| Figure 4. Data from May 22nd 2022 |
It is necessary to extract useful information from the data, for the six weeks that it is possible to analyse so far.
Covid-19 deaths during each week
Week ending April 10
This is the baseline week and so all we can see is cumulative data starting in December 14th 2020. Note that "vaccination <21days" implies that the vaccination has not had adeqaute time to induce immune protection.
The important data for April 10th is extracted in Figure 5.
 |
| Figure 5. Data extract from April 10th 2022 |
The fact that during the time from December 14th 2020 to April 10th 2022 60.29% of those who died from Covid-19 were not vaccinated does not lead to a useful conclusion. The proportion of the population vaccinated was increasing steadily, not a steady state. It does not tell us about "now", but is frequently advertised by those who are promoting vaccination without being in possession of up-to-date facts.
 |
| Figure 6. Vaccination data up to May 22nd 2022 |
It is obvious that in the early weeks of the pandemic the numbers vaccinated was low, but at present 85% have received at least one vaccination and 82% were double ("fully") vaccinated. 49% had been double vaccinated plus booster.
The tables presented subsequent to April 10th will display just weekly additions, concentrating on "now".
Week April 10 to April 17
 |
| Figure 7. Data extract from weeks ending April 10 – 17 2022 |
This was illustrated in my previous Blog post.
We can also see that 226 of the 227 deaths (99.6%) during this week were in people who had been vaccinated, only one unvaccinated. This might be the result of 99.6% of the population of Canada having been vaccinated, but this is not the case (Figure 6) and we will look at it in more detail later, after we have looked at other weeks. Will this remarkable proportion continue into the subsequent weeks?
Week April 17 to April 24
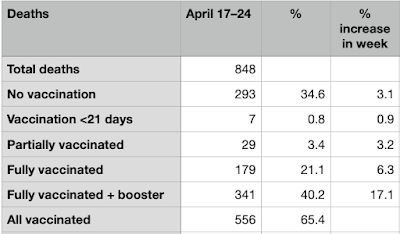 |
| Figure 7. Data extract from week ending April 24 2022 |
 |
| Figure 8. Data extract from week ending May 1st 2022 |
The data from this week are effectively the same as the previous week. PHAC published a two-week update and I have divided the data equally into two separate weeks.
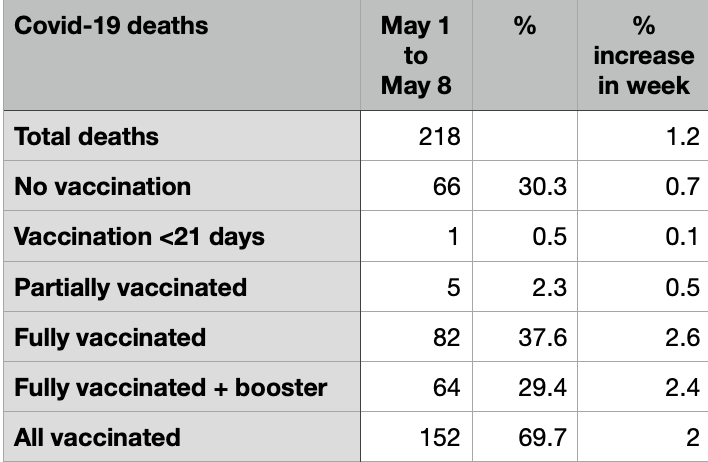 |
| Figure 9. Data extract from week ending May 8th 2022 |
The number of Covid-19 deaths has been lower this week at 218. We can see the numbers for each vaccination status, noting that 30.3% of those who died with Covid-19 were unvaccinated and 69.7& were vaccinated, almost all double or triple vaccinated.
 |
| Figure 10. Data extract from week ending May 15th 2022 |
During this week there were 412 deaths, 10.9% in the unvaccinated, 89.1% in the vaccinated, the great majority being triple vaccinated.
 |
| Figure 11. Data extract from week ending May 22nd 2022 |
During this week, the sixth of the series, there were 459 deaths, 16.3% in the unvaccinated, 83.7% in the vaccinated, the great majority being triple vaccinated.
 |
| Figure 12. Covid-19 deaths weekly, Canada 2022 |
 |
| Figure 13. Percentage of Covid-19 deaths in the vaccinated |
 |
| Figure 14. Number of Covid-19 deaths in Canada by vaccinations status April 10th to May 22nd |
 |
| Figure 15. Vaccination status of the population |
This is very important. The basic data presented above in Figure 14 has no real meaning unless it is standardised for the number of people in the vaccination group. We can achieve this by dividing the number of deaths in each group by the percentage of the population in each group. This is looking at ratios between the four categories of vaccination status. The results can be seen in Figure 16.
 |
| Figure 16. Corrected effect of vaccines in Canada |
 |
| Figure 17. Effect of vaccines in Canada, April 10th to May 22nd 2022 adjusted for proportion of population vaccinated. |
 |
| Figure 18. UK Covid-19 cases on June 21st and 22nd 2020, 2021, 2022 |
 |
| Figure 19. Australia, Covid-19 cases each day |
 |
| Figure 20, Covid-19 deaths in Canada occurring during the week May 22 to 29 |
Figure 20 shows the numbers of deaths for each vaccination group, and the percentages. We can see that during this week 95.3% of Covid-19 deaths were in the vaccinated and only 4.7% were in the vaccinated.
 |
| Figure 21. Adjusted relative numbers of Covid-19 deaths during the week. |
Once again we can see the failure of vaccination, especially multiple vaccinations, to protect against Covid-19 deaths.

It might not be possible to post comments on this Blog post.