 |
| Tucson, Arizona |
Several of my Posts refer to the epidemic of coronary heart disease (CHD) that occurred in the 20th century, and which is now almost over. I reported this in the medical literature (Quarterly Journal of Medicine) in 2012.
People may question my assertion that there has been an epidemic of CHD, but as I have mentioned previously the evidence is well documented. The national documentation requires a level of organisation which is not always present but it is present in the highly sophisticated civil service of the UK and the documents are readily available. The national registration of deaths has been present since the late 19th century, and the great advantage of the NHS is that vast quantities of data have been created and saved.
I have just come across a publication from a medical team from the University of Arizona School of Medicine, concerning “The 20th century epidemic of CHD”. It was published in 2014 in the American Journal of Medicine. The study is based on exclusive USA data and no reference is made to my earlier work, which used mainly UK data.
It mentions that “heart disease” was only the fourth common cause of death in the USA in the early years of the 20th century, but by the middle of the century it had become the most common cause. It did not identify rheumatic and syphilitic heart disease which were present in the early years, but they were declining as causes of death. The deaths from these causes would have reduced to zero by 1970. Something new was appearing to increase substantially the total number of deaths from heart disease.
Working in Chicago, Dr James Bryan Herrick (1861-1954) was in 1912 the first to diagnose myocardial infarction (MI), the most serious and important manifestation of CHD. This is a sudden episode of severe chest pain with collapse and high risk of early death, loosely called a “heart attack”. The clinical diagnosis was straight-forward but it required pathological corroboration from autopsy evidence to understand the condition. A few years later Herrick was one of the first to use the electrocardiogram (ECG) as an aid to diagnosis of MI. Herrick was also the first to identify Sickle Cell Disease, initially called Herrick’s Disease.
But the diagnosis did not just depend on clinical features and ECG. The condition had a high mortality rate. Pathology was of supreme importance and the autopsy was a vital way to learn. At the time imaging procedures were effectively unknown, X-ray machines identifying only major damage to bones.
The correlation between clinical features and findings at autopsy (clinico-pathological correlation) was a major part of medicine until very recently. Whereas in the earlier years of the 20th century the ward round would end in the autopsy room, in later years it would end in the X-ray imaging department. Continuous learning is integral to clinical medicine and looking inside the body is part of this.
And so the pathology of MI, and CHD in general, became well established during early part of the 20th century. The emergence of CHD, the new epidemic, was clear and beyond dispute. There were those who wondered how they could have missed the diagnosis in the years before the First World War, but although they did not fully understand this, the disease was simply not present at that time.
 |
| Figure 1. Decline of deaths from CHD in the USA |
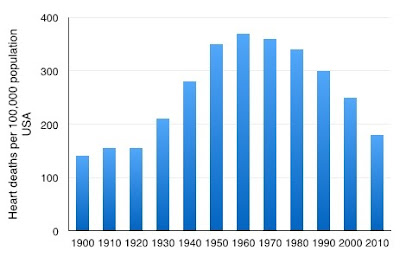
The emergence of a new disease was certainly a mystery, but during the first half of the 20th century there were more important events in the USA and Europe, such as two world wars and a catastrophic economic depression between them. As Dalen and colleagues point out, it was the subsequent sudden decline in deaths from CHD in the late 1960s, clear from good quality national data, that caused surprise.
 |
| Figure 2 The rise and fall of deaths from heart disease in the USA |
The data is not entirely clear. Figure 1 shows deaths from CHD per 100,000. I assume that the data are age adjusted but this is not stated. Similar for Figure 2, but this shows all heart deaths and not just CHD. There is no data given for specific CHD deaths before the 1965 peak but the increase in total heart deaths was clearly due to the emergence of the new CHD.
The peak of CHD deaths is identified as 466 per 100,000 per year, slightly lower than 522 in the UK. The peak in the west of Scotland was an astounding 960 deaths per 100,000 men per year. The decline of heart disease deaths in the USA appears to be only to 130 per 100,000 per years, but this is total deaths. Although the overall decline is the result of many fewer CHD deaths, in the UK the CHD deaths had declined to only 40 per 100,000 per year (age adjusted) in 2007.
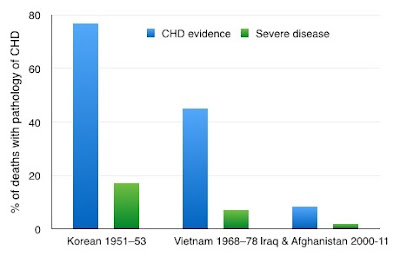
Dalen and colleagues also report autopsy findings in US soldiers killed in wars. In the young men who died in the Korean war (1951–1953), pathological evidence of CHD was found in 77%. This had fallen to 45% in those who died in the Vietnam war (1968–1978), and to 8.5% in those who died in the Iraq and Afghanistan wars (2000–2011). There is clearly a major decrease of the pathological basis of CHD, corresponding to the decrease of deaths in the general population.
 |
| Figure 3: CHD findings at autopsy in young US soldiers killed in wars |
The clinical consequences of CHD were diminishing at the same time, as judged by the decline of admissions to hospital on account of sudden onset of MI.
 |
| Figure 4: Admissions to hospital in the USA on account of MI |
It is interesting to note that the decline was slightly earlier in the younger age-group (<65). This suggests a cohort effect – exposure to the cause was lower or modulated in those born later.
It is also interesting to note that CHD became a milder disease during the years after about 1970, and this is born out by doctors such as myself who were in clinical practice at that time.
 |
| Figure 5: Inpatient death rate following admission for MI, USA |
The milder nature of CHD can be seen in the rapid reduction in hospital mortality rate. It is remarkable now to imagine a 37% mortality rate for those admitted on account of MI in the years slightly before and after 1970. This high mortality rate was also recorded in the UK literature at the time, and I remember it well.
And so putting together Figures 3, 4 and 5, we can see that there has been a major reduction of CHD, judging from autopsy and clinical data, a major decline in the incidence of MI, and also a major decline in the case-fatality rate of those admitted to hospital on account of MI. The result is a major reduction of overall death rate from CHD. These were also the findings of the long-term MONICA project, set up in 1973 to try to find an answer to the mysterious decline in deaths from CHD.
It is very important that in their paper Dalen and colleagues recognise that there was a true epidemic of CHD - that there was a sudden onset, a peak and then a rapid decline. It would be a great contribution to knowledge and research if the epidemic were to be acknowledged generally. There are however many “epidemic deniers”, who assume that CHD has always been present. This means that they need not consider its emergence, but this is clearly very important if we want to understand its decline. Those who deny the epidemic of CHD are obviously completely ignorant of the very clear data.
There have been reports of arterial disease being found in Egyptian mummies. Although this has given apparent justification to the epidemic deniers, it is not the same thing as CHD and it must not imply that CHD has been continuous during the past 4000 years.. There is no reason to assume that there has been only one epidemic of CHD in recent years and particularly in the distant past.
 |
| Figure 6: The 20th century epidemic of CHD in the UK |
The observation of an epidemic is clear. The next stage is speculative, to consider possible causes, to produce hypotheses that can be tested by continuing research.
This will best be developed in another post.
*********************************************


https://www.economist.com/graphic-detail/2017/04/17/margarine-sales-investors-cant-believe-theyre-not-better
ReplyDeleteSee the graph of margarine intake at the same time amazing correlation
Avi cohen