Thursday, 2 April 2020

Covid-19 and Vitamin D: age and deaths


Age and deaths associated with Covid-19

The population of Italy is suffering very seriously from the pandemic of Covid-19, followed closely by that of Spain. The incidence of the disease varies throughout Europe and this might depend on whether the incidence is that of reported cases of illness with positive Covid-19 testing, or less likely, just positive testing. 

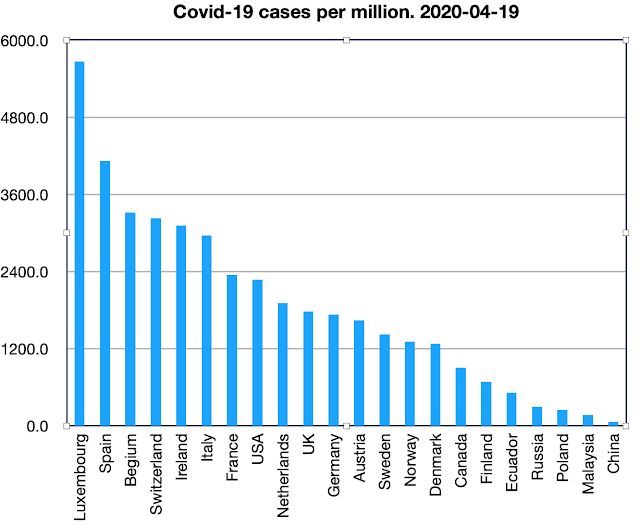
Today (April 19th 2020) there have been 17,8972 cases in Italy, which is 2,958 cases per million population.  Spain has had 4,116 cases per million and the UK 1779. But the highest number of cases of all in to be found in Luxembourg with 5671 cases per million. By April 19th 2020 Belgium, Switzerland, and Ireland had also overtaken Italy in respect of cases per million population.


Deaths per million remain high in Italy and Spain, but now Belgium has the highest deaths per million, for reasons that are far from clear.


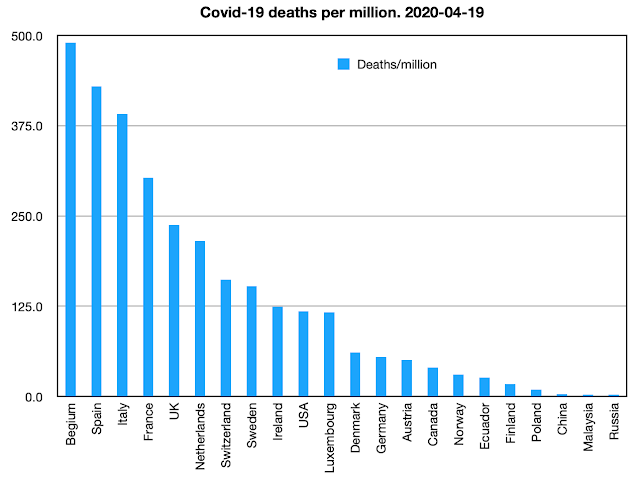
As I have mentioned in a previous post, the number of deaths recored as due to Covid-19 might be cultural, influenced by a nation’s tradition of reporting the cause of death. To try to standardise the incidence of deaths it seems to be sensible to report for each country the number of “Covid-19 deaths per million population". Italy at present has the highest number deaths per million, 217.4, with Spain 210.1. The UK has so far reported a much lower number, 34.8 deaths per million, but the number is rising by the day, more rapidly than that of Italy. The pandemic appeared in Italy earlier than in the UK, and it was expected that UK death incidence might approach that of Italy. Whether that will happen is unclear, but as of April 19th 2020 the gap was not closing.

Cumulative deaths by day, as of April 19th 2020

What happened in Italy early in the epidemic provides a learning opportunity for other nations. The Italian experience is being shared from data analysis undertaken by the Italian National Health Institute.
  
Italian National Health Institute

The information provided is based on what I would consider to be reliable data and good clinical practice. There is no reason to suggest that there has been any suppression of the facts. On the contrary there is complete openness.

The observations (April 4th) are as follows:

Cases: 110,574  (1828 / million population)
Deaths:  13,155  (217 / per million population)

The characteristics of those who have died with positive testing for Covid-19 have been:
Average age 81years;
90% of deceased over the age of 70;
10% of deceased over the age of 90.

80% of the deceased had suffered from two or more chronic conditions.
50% of the deceased had suffered from three or more chronic conditions.
The pre-existing medical conditions were mainly cardiovascular problems, respiratory problems, diabetes, cancer.

Less than 1% of those who died were previously healthy persons.
30% were women, 70% were men.

2 died below the age of 40, both aged 39.
1 had diabetes + complications, 1 had cancer.
It is unclear whether Covid-19 or pre-existing disease caused death.

Northern Italy has been most seriously affected by Covid-19. The characteristics of the population of northern Italy are:
  • high average age;
  • high level of atmospheric pollution (the highest in Europe);
  • high level of respiratory disease and associated deaths previous to the epidemic.
Extreme air pollution (red) over Northern Italy

The cause of death

The Italian National Health Institute stresses the importance of distinguishing between those died from Covid-19 and those who died with Covid-19.

This is a general problem in the death of older people when there is often more than one condition at the time of death: which one to register as the cause of death? 

I pointed out that in Germany the low level of reported deaths from Covid-19 is probably that a pre-existing condition been the registered cause of death. I received from Germany the following comment:


“Wer infolge einer Grippe stirbt, bei dem steht selten "Grippe" auf dem Totenschein – und so ist es auch bei Covid-19. Denn letztlich sind es Komplikationen oder bereits bestehende Grunderkrankungen, die zum Tode führen.”

“Anyone who dies as a result of the flu rarely has“ flu ”on their death certificate - and so it is with Covid-19. Because ultimately it is complications or existing underlying diseases that lead to death.”

In the death of very elderly persons, the major factor leading to death is likely to be “old age”.  This is the inevitable cause of death in mortals who do not die from disease or trauma. These issues are likely to make comparisons between different countries not as robust as we might like.

Studies have shown that the virus tests kits used internationally might give false positive results for Covid-19. They might show a positive result from existing human coronaviruses.

Impact

The most important measure of the impact of the Covid-19 epidemic is the number of excess deaths per week as judged against historical averages for that week. 


This information is collected regularly in Europe, by EuroMomo (European  Monitoring of Excess Mortality for Public Health Action).

EuroMomo still includes UK data, separately for England, Wales, Scotland, and Northern Ireland. It can be found on the following web site:


It is a web data presentation. Overall European data are displayed by age-group, and also displayed by nation. An example is below:


The most recent week displayed is 2020 week 12, which started on Wednesday March 18th. There is a mortality rise in Italy in week 12. On the other hand, the data from England shows death rates marginally below the average for that week.

The impact shown so far might increase and further data will be available shortly. But this relatively small impact might be because so many of the deaths are occurring in people who were already close to end of their lives, as a result of advanced age and with pre-existing serious illnesses.


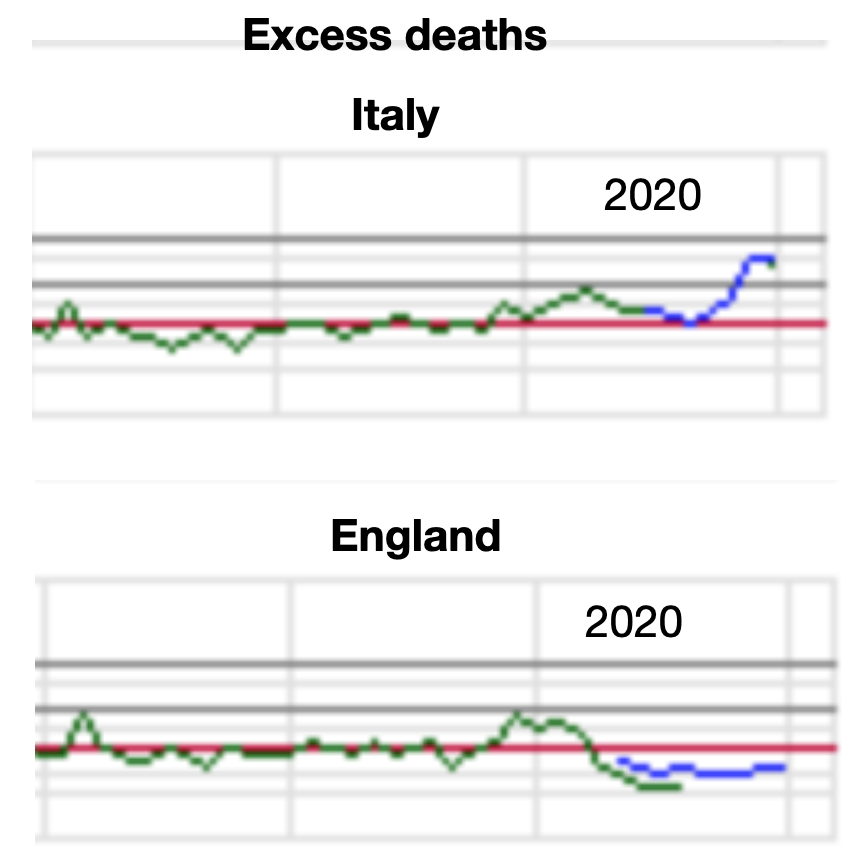
It is this data designed to display excess deaths that will give a true impression of the mortality impact of the Covid-19 epidemic.


Thursday, 26 March 2020

Covid-19 pandemic : The German Paradox


Deaths per million population seems to be the most robust and useful measure of the impact of the Covid-19 pandemic.

But not always – there are some countries in which deaths per million is surprisingly low. The most obvious one is Germany, deaths per million remaining much lower than its neighbours, only a tenth of the deaths per million in Belgium


We have seen that disease incidence, cases per million, can include well people testing positive, or on the other hand just sick or dead people testing positive. Understanding this is helped by a view of tests per million population.


Norway is top of the list of nations with population testing, with more than 8,000 tests per million population (UK 957). Norway has a relatively high level of cases per million (591.1, UK 141.2). This is likely to be the result of extensive testing of people who are not ill, and these are included as “cases”. 

Norway experiences a low death rate of “cases”, 0.4%. There is also a low number of deaths at 2.6 per million population, UK 6.9.

Germany also has a low number of deaths from Covid-19, 2.7 per million. Why is this? It cannot explained in the same way as Norway, as the testing rate in Germany is only 2000 per million, a quarter that of Norway.

Germany has a lot of “cases” 474.1 per million, with a low death rate of 0.5%. What is going on? The number of deaths from Covid-19 is low, compared to a high incidence rate (more than three times that of the UK). How can this be explained? This has been questioned in the media, but without an explanation, even in Germany.

This is not a mathematical aberration, but it is obvious that somehow the deaths from Covid-19 are being under-reported in Germany. It is not a deliberate conspiracy to hide deaths, but the reason lies in medical culture in Germany, and probably in a few other countries with relatively few deaths.

Certified Cause of Death

This has troubled me for a long time. 

The death certificate works on the basis of a single disease causing death.
This is usually straightforward in a younger or middle-aged person. It could be myocardial infarction (heart attack), cerebral infarction or haemorrhage (stroke), road traffic accident, shooting, meningitis, tuberculosis, lung or other cancers, for example. 

The layout of the UK Death Certificate is shown below.


Things became less clear in older people, especially those who die after their 80th birthday. They might have several conditions simultaneously, none being life-threatening on its own, but they add together to create a burden of illness that leads to death. Example are diabetes, hypertension (high blood pressure), heart failure (controlled), obesity, Parkinson’s disease, osteoarthritis, impaired mobility, COPD, dementia.

When the elderly person dies it is often difficult to identify the single disease responsible. In reality the main reason for death is “old age”, in that without disease we will all “conk out” at about the age of 100 (give or take ten years). But the coroner will not like “old age” as a certified cause of death, even though arguably the whole purpose of medicine to to enable people to die from old age rather from disease. It is interesting to note that in the obituaries in the British Medical Journal, “Old Age” is the most common of the given causes of death (in 2020 so far, 20 out of 63, cancers second with 14).

It is mainly the elderly with pre-existing chronic disease who are dying from Covid-19. If this happens in the UK, Covid-19 will be registered as the cause of death (Category I), with important pre-existing conditions being recorded in Category II (not entered into national statistics).

In Germany it appears that things are different. It is the chronic conditions (dementia, heart failure, COPD etc) that will be recorded as the cause of death. Covid-19 would be regarded as the final blow, “the straw that broke the camel’s back”. There is good reason for this if the final event were broncho-pneumonia, developing in the frail individual who is unable to cough. This is called “opportunistic” pneumonia. 

However whereas broncho-pneumonia would not have occurred without the patient being frail, weak, and perhaps bed-bound, we cannot say that about Covid-19. It is not “opportunistic” but it can attack anyone, whether weak or strong, whether old or young. The elderly tend to die following Covid-19 infection because being they (we) are intrinsically weak internally, with reduced vitality or physiological reserve. They have reduced immunity and weak body defence mechanisms in general.

Death statistics

If the average age at death in a population of a million is 100 years, it means that 10,000 people will die on average each year (one million divided by 100). If the average age at death is 80, approximately 12,000 will die each year. So we expect that in the UK with a population of 67.5 million there will be about 810,000 deaths per year, or 2220 per day.  National statistics should be able to display this day by day but I have been unable to identify such data presentation. 

During the month of March 2020 we would see an increase as 422 people have died from Covid-19. 


The graph show theoretical average deaths per day in February 2020, with real UK deaths from Covid-19 added for March. The increase is not clearly seen. However we are interested in excess deaths, those greater than expected. In early 1969 there were 80,000 excess deaths in the UK as a result of Hong Kong flu, but I cannot access day by day data.

The excess deaths become more visible if we adjust the baseline of the graph to just below the theoretical average. We can see the excess deaths and it is these that will identify the Covid-19 pandemic.


Germany has a population of 83.5 million, leading to a theoretic average death rate of 2745 per day. Once again, this could be plotted as a daily number by German national statistics. We would then need to look at the pattern during March 2020. Would it show a cumulative increase of just 157 deaths above what is expected (average 10 per day)?  Perhaps it would show more, indicating the true number deaths resulting from the Clovid-19 pandemic.

Retrospective analysis in various countries will be more informative.


Monday, 23 March 2020

Covid-19 and Vitamin D – air pollution and mortality in Italy


Satellite image showing hot-spot of air pollution in northern Italy

The pandemic of Covid-19 is a serious world-wide problem at present. It is due to a coronavirus related to SARS (Severe Acute Respiratory Syndrome) and MERS (Middle East acute Respiratory Syndrome), and like them it originated in animals.

Covid-19 started in the Chinese city of Wuhan. The spread of the virus in Wuhan was extremely rapid, but effective closure of the city minimised spread elsewhere in China. Air transport enabled the virus to spread rapidly world-wide.

The virus has caused major problems in Iran and in Europe, and within Europe Italy has suffered most in terms of disease and deaths.

It is deaths that are most important. It is easy to forget that in 1968-69, during period of only about two months, 80,000 people died in the UK alone as the result of the pandemic of what we call Hong Kong flu. I was working as a young doctor in the front line at that time. We were taken by surprise by the pandemic, and of course there were no intensive care units in those days.

In the present pandemic "cases" can include people who are ill and test positive for Covid-19, and people who are perfectly well and test positive. As testing becomes more widespread the number of "cases" will increase as more well people are tested.  The numbers of deaths will change more slowly.

Its is considered that:

Death rate (%) = Total deaths x 100 / Total cases

When the denominator (total cases) increases at a greater rate than the numerator (total deaths), the death rate will appear to reduce. This will be a misleading health indicator, and it is a mathematical aberration.

It is much better to use as a health indicator the total number of deaths as proportion of the total population, that is total deaths per million. This is generally robust, but in some nations, for example Switzerland, the resident population might be significantly higher than the official population.

I have constructed a spreadsheet to collect and analyse the data concerning Covid-19 in a number of countries. The data, up-to-date on March 23rd 2020, can be seen below.


The variations within Europe are particularly interesting. 

The death rate as proportion of "cases" who die is remarkable low in Ireland (0.4%), Germany, (0.4%) and Norway (0.3%). Is this due to a large number of well people who have tested positive? If not is it the result of exceptionally good medical services? Or perhaps a common factor that cannot yet be identified.

The same countries have a low number of deaths per million population, Ireland 0.8, Germany 1.3, Norway 1.3. The numbers are greater but still comparatively low. There seems to be a real factor in these countries responsible for the low mortality. 

The low mortality in Germany in particular has been discussed widely in the media but no explanation is forthcoming.

The UK is experiencing 4.9 deaths per million, and 84.2 cases per million, relatively low. Cases per million are much higher in Ireland (184.9), Germany (313.3). and Norway (441.7), but this could be a result of extensive testing of the well population. 

Numbers tested in different countries are available:
https://ourworldindata.org/covid-testing


It can be seen that Norway has conducted far more tests per million population than other European countries. This will explain the high cases per million (441.7) with few deaths per million (0.3). The testing rates in Germany and Ireland are not exceptional.

The testing rate in Italy is second to Norway in the European countries shown, but Italy has an exceptional problem. The Italian people and the health services are struggling. To date there have been almost 60,000 cases and 5,500 deaths. This represents a 9.3% mortality of cases, and an astonishingly high 90.5 deaths per million population.

Many people in Italy have thought long and hard about why this is, as indicated to me by my friend Dr Luca Mascitelli. No explanation is at hand.

However, it is on the Lombardy plain in northern Italy that the epidemic has been most serious and with the highest fatality. The major city of Bergamo has been identified as the epicentre of the epidemic. An inspection of a pre-epidemic image of Europe identifies the Lombardy plain as the area of Europe with greatest air pollution.


Copernicus satellite image showing northern Italy, February 2020.

The Lombardy plain sits at the foot of the Alps, which rise very steeply on the south side. The River Po runs through the plain. The main cities are Bergamo and Milan. Turin is a short distance to the west, in Piedmont. It is a place of motor cars, and restrictions have been suggested in Milan in recent months. It is one of the areas in the world with the least wind.


Lombardy, Italy
The man pollutant detected by the Copernicus satellite has been nitrogen dioxide, but in general air pollution blocks the transmission of sunlight through the atmosphere to ground level. The sunlight is essential for the synthesis in the skin of Vitamin D from 7-dehydrocholesterol. After its activation in the liver and kidneys to Calcitriol, Vitamin D combines with and activates the Vitamin D Receptor enzymes in the cells, in turn switching on a chain of genetic events, stimulated at the DNA level by Vitamin D Response Elements that enhance T-cell activation and the defensive inflammatory cascade.


Activation of intracellular and genetic processes by vitamin D


Enhancement of defensive T-cell activation by vitamin D following micro-organism invasion

It is was established in the early years of the 20th century that vitamin D is essential not just for bone health but for defensive immunity. At that time it was the disease tuberculosis that was particularly important, and for which air quality was so critical. The immune suppression caused by lack of sunlight and vitamin D in the activation of tuberculosis, so obvious in industrial cities, was met again in the late 20th century during the epidemic of AIDS. This was another acquired immunodeficiency syndrome that led to activation of tuberculosis and other conditions.

It is no coincidence that Wuhan, China, also experienced very serious air pollution before the epidemic. Also, it is now the time of the year when immunity and body stores of vitamin D are at their lowest, and it has been noted that this is the time when tuberculosis is most likely to present as an illness. 

And so perhaps this is the explanation as to why northern Italy is suffering so badly at present.

A public health initiative should be to supply vitamin D in large bolus doses to the people of Italy, and other countries where death rates are high. In fact, it is what we all need to help with protection against Covid-19.

The pandemic in Germany is causing surprisingly few deaths. This, the German paradox, is the subject of the next Blog post:

http://www.drdavidgrimes.com/2020/03/covid-19-pandemic-german-paradox.html


Thursday, 9 January 2020

Atmospheric Pollution and Vitamin D – bad air & ultra-fine particles


Bad Air – Miasma 

During the nineteenth century the population of London, like the populations of many European cities, suffered from several epidemics of cholera. The cause of these epidemics was put down to “Miasma”, that is “bad air”. Miasma was the current paradigm in Europe, in that it was the explanation and assumed cause of all sorts of diseases including epidemics. The air was certainly bad, with a “stench” as well as smoke. The physicians of the day were impotent; they could hardly be expected to clean the air. There was no provision for the population at risk to be moved to a location of clean air. 
19th century representation of Miasma

There was no possibility of reducing or prohibiting the burning of coal, but it was the smell of the air ("the great stink") that was considered to be the main factor of miasma. Sir Edwin Chadwick, the first public health physician in England, took action by organising the construction of drains to take the foul-smelling waste into the River Thames and thus rid the populated parts of the city of “miasma”. Unfortunately the drains entered the Thames above the water intake.

Dr John Snow and the Broad Street pump

During the 1854 epidemic of cholera in London a thoughtful young physician Dr John Snow, unlike Sir Edwin Chadwick, was not content with the miasma paradigm. The paradigm was the result of the philosophical approach to medicine – thinking about the problems. Snow had a scientific approach – research. 

Dr John Snow, 1813–1858
His data collection identified the geography of the epidemic, its epidemiology. The cluster of cases of cholera pointed to a specific water pump, the one situated in Broad Street. His advice to stop using the pump went unheeded: everyone (including all other physicians) accepted that the disease was due to miasma, and of course the people wanted water from a convenient pump close to home. The story goes that Snow removed the handle of the Broad Street pump, thus making it unusable. Following this the epidemic came to an end.

Paradigm change

The miasma paradigm came to an end in the latter years of the 19th century but only because there was a new paradigm to take its place: transmission of disease, and specifically cholera, is due to water-borne micro-organisms.

The germ theory opened a new era of medical research, the new science of microbiology. Many new bacteria were to be identified and classified, and linked to a large number of human and animal diseases. Viral and fungal diseases were identified later. By the 1960s when I was a medical student it might have been thought that all of microbiology was known, but this was very far from reality.

Bad air again

The miasma concept did not completely disappear and it is now being revived. During the latter half of the 19th century and the first half of the 20th century “bad air” was a very serious problem in Europe. Whereas clean water was the priority in the 1880s, clean air became the priority in the 1950s. 

A major effect of air pollution by smoke was and still is the inhalation effect causing chronic lung disease, chronic bronchitis, later called chronic obstructive pulmonary (lung) disease (COPD). It was because of the large number of deaths from what was then called chronic bronchitis that the UK Government introduced the Clean Air Act in 1956, and it turned out to be the very effective

Sunlight and immunity

During the 19th and early 20th centuries, the other major health effect of air pollution was recognised as being a reduction of sunlight penetration to ground level, resulting in vitamin D deficiency and rickets. The knowledge of this seems to have been lost in recent years.


Robert Koch had demonstrated tuberculosis (called consumption, phthisis, or even Koch’s Disease) to be caused by a bacterium – Mycobacterium tuberculosis, or Koch’s bacillus. However here we find an interaction between bacterial infection and the susceptibility of individual people. 

Towards the end of the 20th century it became obvious that reduced immune competence (as in AIDS) makes tuberculosis more likely to occur, and this is also an effect of vitamin D deficiency. Blockage of sunlight by polluted air (or by staying indoors) has serious effects on immunity, and an increased risk of tuberculosis is just one of them. 

It had been demonstrated by Niels Fyberg Finsen in 1905 that tuberculosis of the skin (lupus vulgaris) could be healed by exposure to UV light.

Bad air today

I remember that when I was a young boy in Manchester, UK, it was possible in the winter months to look directly at the sun, which was often just a pale disk in the sky. 


Taj Mahal in polluted air

This is now a feature in the newly industrialising countries, particularly China and India. On a "cloudless" day in many cities such as Beijing and other industrial cities of China it is not possible to see the sun due to the high level of pollution, and things are similar in Delhi and other Indian cities. In fact most heavily polluted atmospheres are in Indian cities. The health consequences of this are yet to emerge, but vitamin D deficiency can be predicted.

This is no longer the case in the UK and other European cities today and the air quality is very much improved compared to what it was in the 1950s. The carbon particles are now different. The pollution today is with ultra-fine particles and these cannot be seen. They do not seem to block the sun and the air appears to be clean.


London 2018

In London and other European cities in the mid-20th century, the main pollutant was the industrial and domestic burning of coal. Coal had a high content of sulphur, and major pollutants were sulphur dioxide and sulphurous acid, both very toxic to the lungs.

Motor car fuels, with petrol and diesel, have also been responsible for the release of toxic sulphur gases into the atmosphere, mainly in the cities. However legislation has resulted in the the purification of fuels for road vehicles to virtually eliminate the sulphur content. 


Decline of sulphur content of road traffic fuel in UK since legislation

January 1st 2020 will see the introduction of rules by the International Maritime Organisation to allow shipping to use only low sulphur fuels.


"Toxic air" – Ultra-fine particles

In the EU the air has become much cleaner since the mid-20th century, but despite this obvious change we are told that our air is "toxic" and is causing enormous damage to us in a large number of ways. Ultra-fine particles apparently pass through the bronchial tree and into the depths of the lungs, then entering the body. However undesirable this might be, it cannot be assumed that they are causing disease. The fact is that in the UK and the EU in general, life expectancy continues to rise. We are healthier than ever before.


PM – Particle Matter
Ultra-fine particles cannot be seen with the naked eye but they can be measured in a laboratory. A detailed summary was produced by a UK government working group in 2018. Ultra-fine particles have a diameter less than 100 nanometers, or <0.1 microns. With the improvement of fuel quality and combustion processes there has been a significant reduction during the early years of the 21st century and a further reduction is anticipated, especially if there is a major reduction in the use of carboniferous fuels.


Decline of ultra fine particles

I am not proposing that we should be complacent. There is a serious problem of too many cars on our roads, but like everyone else I want to keep mine! It will be many years before we change to electric vehicles and domestic heating by electricity. Even though more than half of electricity generated in the UK in 2019 was from non-carbon sources, the source of additional generation of electricity in the future remains uncertain. 

Microplastic pollution 

There is also concern about plastics. The effect of large plastic waste products on sea life is obvious and very tragic. However there is also a problem with microplastic pollution. It has been observed that these are present in the seas and in sea life, but recent studies have detected microplastic particles in the air. They are present in many cities with London having the highest recorded levels. 


Micro-plastics
Once again it is not clear whether they are toxic or inert, and whether or not they have a detrimental effect on human health. A study in 1998 demonstrated microplastics in cancerous human tissue, but a causative role cannot be assumed. Apparently we consume about 50,000 microplastic particles per year. They decompose extremely slowly, and if they are toxic the effects will be with us for a long time.

Disease attributed to air pollution

I cannot help thinking of the miasmic theory when I read assertions that present-day diseases "are the result of" atmospheric pollution. I find it perfectly reasonable to accept that 41% of global deaths from chronic obstructive pulmonary disease (COPD) are the result of the inhalation of toxic air pollution. However to state that 20% of Type 2 Diabetes deaths are the result of air pollution stretches credibility. 

Similarly it is stated that 19% of deaths from lung cancer are due to air pollution. We know that most lung cancer has been caused by cigarette smoking, but atmospheric pollution has not been an accepted cause. At present, at least in the UK, there seems to be a significant epidemic of lung cancer in "never-smokers", and 80% of cases are in women. This is a great worry but there has been no good evidence that it is the result of atmospheric pollution. The possible role of microplastics requires further evaluation.

To state that 16% of deaths from coronary heart disease (CHD) are the result of atmospheric pollution is very suspect. Which 16% ?Are these deaths in countries that experience a high level of air pollution? Is there really a link? The reality is that deaths from coronary heart disease have shown a major epidemic of the latter half of the 20th century, and the epidemic is now effectively at an end. To link atmospheric pollution to the major decline in coronary heart disease deaths at the present time would not be realistic. I have expressed my conclusion that coronary heart disease must be due to micro-organisms.


On November 18th 2019 we read in the UK press that: "Air pollution from homes, industry and cars kills five people a week in Bristol", and  up to 36,000 per year in the UK. Who are these people? What was the precise cause of death, remembering of course that "air pollution" is not a recognised cause of death. This is poor quality research that adds very little but as a scare story, it creates headlines. Once again there is the proposal that air pollution contributes to asthma, lung cancer, heart disease, stroke and diabetes. Of these only a link to asthma has plausibility. The others are purely speculation without any direct plausible mechanism.


Earlier in the year a delightful 9 year-old girl in Lewisham, south London, died as a result of asthma. It was claimed by her mother that the cause of death was air pollution, and this has received a great deal of attention by the national press. Air pollution is not a recognised cause of death, and the reality is that the child died in a severe attack of asthma. She had experienced 24 admissions to hospital on account of asthma during the previous 3 years. I can understand the concern of the mother as the family lived 25 metres from the notoriously busy South Circular Road. Asthma is not due to air pollution, but inhalation of smoke and other chemicals can precipitate a severe attack. It would not have been possible stop traffic movement outside the house, but perhaps there could have been assistance to the family moving into a rural environment.

On Thursday November 28th 2019, the national press reported that the "Impact of air pollution on health may be far worse than thought.... almost every cell in the body may be affected by dirty air". It suggested that atmospheric pollution might have a causative role in heart failure, urinary tract infections, strokes, brain cancer, miscarriage, and mental health problems

This newsfeed is based on a recent British Medical Journal paper, which draws on USA Medicare data concerning hospital admissions and discharges. There is no reason to suspect that the findings cannot be applied to other countries. 

At the same time we learned that 90% of the world's population are exposed to air pollution above the WHO recommended upper limit.  We are told that air pollution increases the risk of glaucoma, a condition in which the pressure inside the eye increases and this can lead to loss of vision if not treated.

A press release on December 19th 2019 informs us that depression and suicide are linked to air pollution, and that "cutting the air pollution around the world to the EU's legal limit could prevent millions of people becoming depressed." It was pointed out that intermediary mechanisms are unknown, and thus only conjectural.

City life

Life is much more pleasant in a rural environment: the contrasting health between the citizens of Manchester and Salford, UK, and those of surrounding villages was first investigated and publicised almost 300 years ago, as I described in an earlier Post. As it was then, so it is now and employment tends to be concentrated in growing cities and not in the countryside. For those in employment, rural living usually means a long commute, mainly by car.

Stalybridge, Manchester in 1950

Stalybridge, Manchester in 2018

There is clearly a health advantage to rural rather than inner city living but the health issues and reasons for this are complex. Can the visible air pollution in major cities in India and China be equated to the invisible ultra-fine particle pollution in London and other similar cities in Europe and North America?

Is the air in London "toxic" or are there other reasons for health disadvantages? The wide range of illnesses associated with air pollution suggests common susceptibility rather than true cause.

If it the result of atmospheric pollution, could the susceptibility be the result of reduction of sunlight penetration to ground level?  This will certainly be the case very in the major cities of India and China in which there is very obvious visible air pollution. 

It is strange that in the many recent articles that I have read on the subject of the  detrimental health effects of air pollution, I have not seen any mention of the interference of penetration of sunlight to ground level. It is as though there is a conspiracy to ignore the obvious great importance of the sun to human health and the role of the sun and vitamin D in maintaining good immunity and good health.

The importance of the sun.

We know that the sun has at least four metabolic effects on our bodies, three of which will have a protective effect on the cardiovascular system. They are as follows.
  • Vitamin D is synthesised in the skin from 7-dehydrocholesterol  by the action of the sun. Vitamin D in its twice-activated form calcitriol activates (via the intracellular vitamin D receptor) specific genes that are involved in turn in activating immune defensive processes. Immunity is very important in the control of infection and in the prevention of CHD.
  • It has become clear that there is a cardiovascular benefit from sunlight acting on the skin that is independent of vitamin D synthesis. The action of the sun on the skin synthesises nitric oxide from nitrates circulating in the blood and passing through the skin. The role of nitric oxide is not completely understood but it appears to have a significant role in control of arterial health and blood pressure.
  • It also appears that skin cells (keratinocytes) are activated by sunlight to in turn activate immune mechanisms within the body. Once again this will be of benefit in CHD.
  • Finally, the sun, acting through the eyes  stimulates the pineal gland within the brain to secrete melatonin. This is of importance to brain activity but it does not at present appear to be of direct cardiovascular benefit.

Intermediary mechanisms

However I emphasise the point that understanding the link between air pollution and disease is essential, as without it we have no plausibility. We have great experience of the effects of air pollution in the UK in the 19th and 20th centuries, and the benefits of pollution controls. The major problem was obstruction to sunlight with vitamin D deficiency: this will indeed affect "almost every cell in the body".

The insistence that bad air causes so much premature death without  any clear intervening mechanism effectively brings us back to the miasma theory, which was replaced by the germ theory more than a century ago. But the germ theory is being ignored by those who are understandably concerned about the effects of air pollution. This is at the time of a huge expansion of the germ theory. The identification of the immune-enhancing effects of the sun would bring together air pollution and the germ theory.

New analytical techniques have demonstrated many more varieties of micro-organisms that are part of the human microbiome. Many have be linked to a variety of human diseases, most chronic, but “proof” will be very difficult in the absence of transmission studies and long-term follow-up. 

However it is looking as though a large number of human diseases are the result of changes to our microbiome. This must be linked to immune mechanisms, and acknowledge the importance of air pollution and the importance of sun exposure.

Sunset – Conwy Estuary, North Wales