Tuesday, 24 May 2022

Covid-19 & VItamin D: Canada –vaccination effects in April 2022


Can this be true?

Yes, it is true. 


When I saw this headline, I thought that it could not possibly be true. The obvious way for me to find out the truth was to look at official data from Public Health Agency Canada (PHAC). This I did, and I would like to share the data with you. 


This Blog post involves a lot of numbers, but only simple sums, what we would have learned in primary schools. The Figures might look complicated but please bear with me and the steps are really quite easy. I have simplified the data tables from PHA Canada, initially concentrating on deaths only and ignoring gender. I show the full tables from the PHAC reports as I want to emphasise that I am using authentic official data that is open to the public. My numbers are not fiction or misinformation, but the truth.


Vaccinations (strictly mRNA injections) were first introduced in December 2020, and the reports from PHA Canada show cumulative numbers of serious Covid-19, hospital admissions, and deaths since then. During the first six months very few people had been vaccinated, and then only once. The number increased rapidly during 2021 and most people with second vaccinations, for many a third following in 2022. 


In the reports, vaccination status is recorded as follows:

  • No vaccination, (Vax 0)
  • One vaccination, but very recent (<21 days) so that it could not be considered to have a defensive effect.
  • Part vaccinated, that is one vaccination more than 21 days previously (Vax 1)
  • Fully vaccinated, that is two vaccinations (Vax 2)
  • Fully vaccinated plus additional ("booster")  (Vax 3)


Public Health Agency Canada (PHAC) data


April 10th 2022

The analysis by the PHA Canada identified 2,091,432 patients ("cases") who had severe outcomes from Covid-19 by April 10th 2022. Of these 85,267 had been admitted to hospital, that is 0.75% of those who were seriously ill. 15,775 died, which is 18.5% of those admitted to hospital, a similar proportion to results from other nations.


Of the 15,775 who died, at the time of death 9,511 were unvaccinated, 2,770 were fully vaccinated (two vaccinations) and 1835 had an additional booster. 


Figure 1. Details from PHAC report April 10th 2022


We can see the details in Figure 1. Concentrate on "Deaths". A simplification will follow in Figure 2.


 60.3% of those who died between December 2020 and April 10th 2022 were unvaccinated, whereas 11.63% were fully vaccinated plus booster. 5.5% were partially vaccinated (x1) and 17.6% were fully vaccinated (x2). It looks at first sight as though being unvaccinated is a serious disadvantage and that vaccinations are life-saving. However this is cumulative data from December 2020, at a time when no-one was vaccinated. 


Conclusions cannot be drawn from results over a time of such major change. If we want to know the effectiveness of vaccinations, ideally we must look at the results of a randomised controlled trial (RCT), in which all subjects would start and end the study at the same time. However, no RCT has been conducted for long enough to assess the effect on severe disease and death. It is therefore necessary look at observational data of high quality, such as provided by the PHAC weekly reports.


Because data from December 2020 to April 2022 have been included, and with major changes taking place in the number vaccinated, the results can have little meaning at the present time. The overall result as outlined cannot be used to predict risk to individuals now or in the immediate future. In the early months when most deaths occured, the vast majority of the population would inevitably have been unvaccinated. 


What is the effect of vaccination "NOW" ?


It is essential to look at “now”, as this is much more relevant to us as individuals than what happened more than two years ago. "Now" means we are looking at data that we can use to help us decide what to do for the best. If we want to look at “now”, we can look at the official Canadian data and in particular what has happened during the single recent week between the reports of April 10 (Figure 1) and April 17 (Figure 2) 2022.


We can summarise that on week April 10th the cumulative deaths were:


Total deaths 15,775

Unvaccinated  9511

Vaccination <21 days, not expected to be effective, 783

Partially vaccinated (x1) 876

Fully vaccinated (x2) 2770

Fully vaccinated plus booster (x3) 1835


The report of April 17th 


Figure 2. Details from PHAC report April 17th 2022

If once again we concentrate on deaths, we can see the following results:

Total deaths 16,002

Unvaccinated  9512

Vaccination <21 days, not expected to be effective, 782

Partially vaccinated (x1) 881

Fully vaccinated (x2) 2832

Fully vaccinated plus booster (x3) 1995


Therefore the total number of Covid deaths during the specific week April 10th to April 17th increased from 15,775 to 16,002, which is an increase of 227.


What happened during the week April 10th to April 17th


Covid-19 deaths among the unvaccinated increased from 9511 to 9512, an increase during the week of just one. Only 1 of the 227 Covid-19 deaths was a person who had not been vaccinated. Let this true but unpublicised fact sink in.


The deaths among the very recently vaccinated (not expected to be protected) for some reason went down from  783 to 782, perhaps a printing error rather than a resurrection.


Deaths among the partial vaccinated (x1) increased from 876 to 881, which is 5 additional deaths.


Deaths among the fully vaccinated (x2) increased from 2770 to 2832, which is 62 additional deaths.


The number of “fully vaccinated with an additional dose” (x3) who died increased from 1835 to 1995. The increase during this week was therefore 1,995-1,835 which is 160.


Of the 227 Covid-19 deaths during this week in April, 226 had been vaccinated at least once. This is 226 x 100 ÷ 227 = 99.6%.


These results are summarised in Figure 3. You will appreciate that we are dealing with elementary grade sums.


Figure 3. Summary of PHAC reports of April 10th and 17th 2022

The more vaccinations, the greater the risk of death 


We can calculate the relative percentage increase of Covid-19 deaths during the week of April 10th to April 17th 2022. It is the number of deaths during the week divided by the April 10th cumulative deaths (the baseline) expressed as a percentage  with two decimal points. These results are shown in Figure 4.


Figure 4. Percentage changes in deaths between April 10th and 17th 2022


The overall increase was 1.44%. It was 0.01% in the unvaccinated, 0.57% in the single vaccinated, 2.24% in the double vaccinated, and 8.72% in the triple vaccinated.


We can look at this is graphical format in Figure 5:


Figure 5. Percentage increase in Covid-19 deaths between April 10th and 17th 2022 
according to vaccination status


This effect of vaccination on Covid-19 deaths can only be viewed as alarming.


April 17th to May 1st 2022


It is important to look at other weeks so as to make certain that we are not dealing with a major printing or other error. I have now been able to look at the most recent report by PHA Canada, which takes us up to May 1st, two weeks after April 17th. Figure 6 displays the data.


Figure 6. Details from PHAC report May 1st 2022


We now need to add this to the summary of the previous week, and this can be seen in Figure 7.


Figure 7. Details from PHAC report May 1st 2022 added to results
 from April 10th and April 17th

During these two weeks, April 17th to May 1st, there were an additional 1696 Covid-19 deaths, 6.2% increase among the unvaccinated and 55.1% in those vaccinated once, twice or three times, added together. 


For comparison with the previous week we can express these numbers as an average of 3.1% and 27.5% increases per week. The greatest weekly increase was 17.1% in the triple vaccinated.


Once again we can see a gradient of increasing risk of death with the number of vaccinations given (Figure 8).


Figure 8. Percentage weekly increase in Covid-19 deaths 
between April 17th  and May 1st 2022 
according to vaccination status


What is also alarming is that in the week April 10th to April 17th there were 227 additional deaths, whereas in the two weeks to May 1st there were 1696 additional deaths, or 848 per week. This is almost a quadrupling of Covid-19 deaths.


Why has this not been reported by PHAC?


It looks as though in April 2022 there was a considerable advantage in not being vaccinated. Unfortunately it is not possible to become de-vaccinated.


This analysis is very simple to those who can locate the data. It could have been undertaken week by week by Public Health Agency Canada. I wonder why this has not happened!


It would have been of great help to the population of Canada (and the rest of the world), but of course it might not have been so helpful to those who aim to repeatedly vaccinate the entire population of the world. We hear from official sources that the vaccinations are highly effective and are very safe. We are told that more vaccinations are esential, the fourth and now the fifth.  We are not told the details from Canada.


Covid-19 hospital admissions


You will have noticed that the tables from PHA Canada provided additional data concerning gender and hospital admissions, I have avoided these so far, for the purpose of simplicity. However the hospital admission data shows the same patterns as deaths. I will abbreviate the data display by just showing the summary data and the graphs, but you can refer to Figures 1,2,6 to see the PHAC numbers.


Figure 9. Covid-19 Hospital admissions, weeks of April 10–17 and April 17 – May 1st

In Figure 9 the data again show the greatest increase in hospital admissions due to serious Covid-19 in those fully vaccinated, and with a booster (Vax x3).


Figure 10 shows graphically the increase of hospital admissions according to vaccination status, the week of April 10th to April 17th. Once again there is a gradient of hospital admission risk according to vaccination status.


Figure 10. Effect of vaccination status on Covid-19 hospital admission 
during the week April 10th to April 17th 2022

We can go on to look at what happened during the two weeks sunsequent to April 17th 2022.


Figure 11 shows graphically the average weekly increase of hospital admissions according to vaccination status, during the two weeks of April 17th to May 1st.


Figure 11. Effect of vaccination status on Covid-19 hospital admission 
weekly average of April 17th to May 21st  2022

It is quite clear that as with Covid-19 deaths, vaccination has a very significant effect of increasing risk of hospital admissions. The third vaccination seems to be by far the most damaging, but data from a fourth vaccination are not yet available.


Why might vaccination be so damaging?


It appears that vaccinations against Covid-19 are reducing immunity and making us more susceptible to serious infection, and perhaps death. It could be due to toxicity, but as I suggested in previous Blog posts that the problem might be that the intense immune responses stimulated by vaccinations are inevitably consuming our Vitamin D reserves. It is then by inducing Vitamin D deficiency that our immunity reduces and our resistance to damaging Covid-19 diminishes. 

The more vaccines given, the greater the depletion of Vitamin D, and so the third vaccinations have the most profound damagung effects.

I know of no research into this suggestion and being retired I am no longer able to undertake such research myself. However vaccination-induced Vitamin D deficiency would be very easily treated so as to reverse damaging effects of vaccinations. Vaccines need Vitamin D.


We now need Vitamin D more than ever.


We have seen the Canadian experience. What about the rest of the world?


See next Blog post.


Reply to comment 1.

Anecdotes are very important initiating steps to knowledge. What you write makes perfect sense if my proposal is correct, that multiple vaccinations are increasingly damaging to immunity as they consume Vitamin D and make us seriously deficient. Take vitamin D with vaccinations. I had two vaccinations to enable me to travel abroad, and I took Vitamin D 100,000 units extra two weeks before each vaccination. No problems. Now back on 20,000 units every Sunday. This could be advised officially but it is not happening. Also simple research opportunity.

David


Thursday, 7 April 2022

Covid-19 & Vitamin D – why is there no herd immunity?


The Covid-19 pandemic has been in progress for a little more than two years, but daily Covid-19 records are still being broken, as in this report from England, similar from Scotland. Why has it not settled? For how much longer will case numbers increase and records be broken?

When the pandemic of Covid-19 emerged in early 2020, the plan of governments collectively (following directives from the WHO) was that the answer must be "vaccinations" (strictly m-RNA injections), which were to be manufatcured as a matter of urgency for the world, and with a great deal of financial support from governments. The introduction of vaccines was anticipated to be at the end of 2020 (at least in the wealthy nations that could afford the vaccines) with the pandemic coming to an end during 2021. 

Herd immunity

It was confidently expected that vaccinations would lead to herd immunity more rapidly than would be the case with nature. 

Herd immunity means that the great majority of the population has immunity, either as a result of infection and recovery, or by vaccination. Historically natural infection followed by survival and immunity has been by far more important, and it has stood the test of time. However the WHO has recently given vaccination a priority in the definition of herd immunity.

In the winter of 1968–69 there was a pandemic of what we called "Hong Kong Flu". It affected a large proportion of the population and it caused an estimated 50,000 deaths in the UK. At the time I was the resident medical officer (RMO) at the Manchester Royal Infirmary, and I can remember how this and other hospitals were overwhelmed by emergency admissions and many deaths. Flu vaccinations were given, but they were of very doubtful effectiveness. Tests for viral antigens and antibodies were not possible at that time.

There was a minor peak in late 1969 but the pandemic settled without any of the multiple peaks that we have seen recently. Herd immunity appears to have been reached after about a year.  The important thing about herd immunity is that it is permanent, locked into the immunity "memory" cells. It also becomes hereditable and is passed on to future generations. Hong Kong Flu has not returned.

At present there is no indication of herd immunity being reached with case numbers still increasing.


Covid-19: no treatment given

While waiting for the vaccines to become available, people diagnosed with Covid-19 were given no treatment and clinical doctors were not allowed to give treatments which could have helped, including VItamin D (especially in its activated form Calcifediol), Hydroxychloroquine, Ivermectin, Beclomethasone aerosol, Vitamin C, and Zinc. People diagnosed with Covid-19 were told to go home, and then to go to hospital if they had difficulty in breathing. It was a disgrace.

It was  promised that vaccinations would end the pandemic, but this did not happen. Something went wrong. In all countries we find similar patterns of the pandemic not settling, and on the contrary case numbers are increasing in multiple peaks, by a factor of up to one thousand.

There are more cases in 2022 

Covid-19 cases per day were higher in the first quarter of 2022 than in the same month in 2021 (Figure 1, below). During March 2021 case numbers were decreasing, but this is not happening in 2022.

We have seen during the previous two years that case numbers fell during the Vitamin D production season of May to August. This should happen again in 2022 but we cannot make any clear predictions.

Many governments have abandoned policies such as mask-wearing, social distancing, and lockdown. Schools and work are now back to normal. For a change in policy at a time of the highest case-rates compared to previous years indicates that governments have abandoned such policies because they have been of no obvious benefit – but of course they have been very damaging to education and the economy, and to many individuals. There will of course be no apology for failure and further vaccinations are being encouraged.

The pattern of Covid-19 is obvious not just in the UK but in many other countries. There have been several peaks that were not predicted and which are not readily explained, but we can recognise that each peak is higher than the one before.

UK

We can look for example at the past three years in the UK, remembering that it was only in March 2020 that the pandemic emerged. At that time there was major concern, and we were subjected to almost total lockdown. But we can compare cases per day in 2020 (blue) with what happened subsequently in 2021 (green) and 2022 (grey). In retrospect the experience of 2020 appears to be quite trivial.


Figure 1. UK Covid-19 cases per day in 2020, 2021, 2022 

It is strange and certainly unexpected that the number of Covid-19 cases per day is so much higher in 2022 than in 2021. It was anticipated that the vaccination programmes during 2021 would have brought the pandemic to an end. But it has not happened, and the pandemic has become worse.

The pattern of Covid-19 is obvious not just in the UK but in many other countries. There has been a series of peaks that were not predicted and which are not readily explained. But we can recognise that succeeding peaks have been progressively higher. 

My previous reports have displayed bar-charts (such as Figure 1) that I have constructed from data displayed daily on "worldometer". However several countries, including the UK, have stopped reporting numbers regularly, and some cases altogether. Even with the UK our Covid-19 case numbers and death numbers are no longer displayed each day, and to find the numbers involves searches from a variety of sites.

However "ourworldindata" continues to supply daily Covid-19 data from around the world, but usually after a few days delay. I will show graphs from this source.

Israel

To understand (or try to understand) what is happening in the Covid-19 pandemic, let us look at Israel as another example. This is about the earliest and most completely vaccinated nation.

First we can see in Figure 2 the first four peaks that occured during 2020 and 2021, and these caused great concern. The head of Pfizer, as a child a survivor of the Holocaust, had promised Israel to be the recipient of the first Pfizer vaccines (and unknowingly the subjects of post-marketing surveillance). The failure of vaccinations to stop the pandemic was not encouraging, but successive vaccination programmes continued.

The first four waves are obvious, two in 2020 and two in 2021.

Figure 2. Israel Covid-19 cases 2020 and 2021

But the pandemic waves in 2020 (maximum 6,000 cases per day) and in 2021 (maximum 10,000 cases per day) 
became less significant when we moved into 2022. The case number hit a maximum of 100,000 per day, ten times the experience of 2021. What has been going wrong? What will happen next?

Figure 3. Israel Covid-19 cases 2020, 2021 and 2022

Japan

We can see the same in Japan, five waves in 2020 and 2021, with a maximum 25,000 cases per day.

Figure 4. Japan Covid-19 cases 2020 and 2021


And then an enoromous sixth wave in 2022, maximum 94,000 cases per day. What will happen in the near future is impossible to predict.
Figure 5. Japan Covid-19 cases 2020, 2021 and 2022


Germany

The same pattern occured in Germany, five waves during 2020 and 2021, with a maximum of 60,000 cases per day.

Figure 6. Germany Covid-19 cases 2020 and 2021

But then in 2022 a sixth wave with more than 200,000 cases per day. This peak is stubbornly persistent and in early April it is still increasing.

Figure 7. Germany Covid-19 cases 2020, 2021 and 2022


New Zealand 

New Zealand appeared to be protecting itself very well during 2020 and 2021, and was applauded as showing great success from is lockdown enforcement. Case numbers were low with the late 2021 peak reaching only about 200 cases per day, and that was after the vaccination programme was well-established. Cases per day were strangely higher following the vaccination initiative.

Figure 8. New Zealand Covid-19 cases 2020, 2021

But these peaks and numbers are of little significance when we see the current peak in March 2022. New Zealand is now experiencing 20,000 new cases each day. Something has gone seriously wrong, and a one hundred-fold increase in cases per day was completely unexpected. Despite this the end of lockdown enforcement is under way. 

Figure 9. New Zealand Covid-19 cases 2020, 2021 and 2022

Hong Kong

Hong Kong shows a similar peak in March 2022, with more than 60,000 cases per day. The previous numbers of daily deaths can now be regared as insignificant. The present increase is about one thousand times the previous numbers 
Figure 10. Hong Kong Covid-19 cases 2020, 2021 and 2022

South Korea

During 2020 South Korea was applauded for its military style  tight lockdown and there were very few Covid-19 cases, fewer than 1,000 per day. In late 2021 the number increased to 7,000 per day. 

Figure 11. South Korea Covid-19 cases 2020, 2021 and 2022

But in the early Spring of 2022 the numbers increased dramatically, to an astonishing maximum of 400,000 cases per day. Why did this happen following an extensive vaccination programme?

Figure 12. South Korea Covid-19 cases 2020, 2021 and 2022


I could go on to show many other countries, with a graph displaying 2020 and 2021, and then one to include 2022. But the point is obvious that case numbers in 2022 in many countries have overwhelmed by a factor of ten or more the case numbers in 2020 and 2021. We were told that with vaccinations the pandemic would rapidly come to an end, but the reality is that it has become much worse.


Covid-19 death rates are lower in 2022.

As shown in the example of the UK (Figure 13) Covid-19 deaths per day are much lower during the first quarter of 2022 than the same quarter in 2021. However at present in early April 2022 Covid-19 deaths per day are more than in 2021, with a tendency to increase.

Figure 13. UK Covid-19 deaths per day 2020, 2021 and 2022


It is stated that vaccinations have prevented thousands of deaths, but we cannot be certain of this as there has been no appropriate randomised controlled trial. The lower numbers of Covid-19 deaths per day during the pandemic can be seen in the example of the UK. 

You live every day, but you die only once.

There is an obvious explanation for fewer deaths in 2022 than previously in the pandemic.

You will remember that at the beginning of the pandemic, deaths were almost exclusively in the very highly vulnerable. Covid-19 deaths per day reduced during the Summer of 2020 and the Spring of 2021, but there were high numbers in the winter months of no vitamin D production.

The very highly vulnerable died early in the pandemic, and they could only die once. 

It is inevitable that it will be some time before a new cohort of very highly vulnerable will develop from the remaining just vulnerable members of the population. It is always the case that a peak of deaths in the first year of a pandemic is followed by lower than average death rate in the next one or two years.

The vaccinations 

Although vaccinations might have reduced the severity of Covid-19, it would appear that the vaccinations have failed to deliver the anticipated success.

Something has gone wrong with the vaccinations. I have suggested in a previous Blog post that vaccinations, in stimulating the immune response would inevitably have consumed Vitamin D, as a molecule of Vitamin D as 1,25(OH)D can only be used once. Immunity would inevitably suffer.

Are vaccines failing because Vitamin D supplements have not been given with the vaccinations? – especially as we are only just approaching the Vitamin D production season.

The effect of vaccines on immune mechanisms needs further evaluation in a future Blog post.

Note:
Replies and comments that I try to publish are longer accepted, and I cannot understand this. I will need to post my replies in this main text.

This is my reply to Comment 1:

From the beginning of the pandemic, reports of Covid-19 "deaths" have been deaths of people who have tested positive for Covid-19 during the previous 28 days. This definition has not changed, but overall it could have overstated Covid-19 deaths.
Observation of increased Covid-19 cases leads to an suggestion of greater transmissablity of successive variants, but it could equally be the result of a progressive reduction in the immune response of the population.
It now appears that the triple vaccinated have a higher incidence of cases and deaths then double vaccinated and unvaccinated. It also appears that this data will no longer be published in Scotland.

Reply to comment 3: (my reply could not be published)
"The large print giveth and the small print taketh away". That is, our hope for Vitamin D enlightenment. 
The government asks for "advice" concerning vitamin D, but in the text is that this advice is in repect of muscle-skeletal health only. No mention of immunity. But I will try to win the battle for vitamin D.


Thursday, 10 March 2022

Covid-19 and Vitamin D – study from Liverpool


Covid-19 and Vitamin D – a study from Liverpool

Liverpool water-front

We have just seen the publication of another paper concerning the outcome of Covid-19 in relation to the blood level of Vitamin D. This study was undertaken in Liverpool, UK.

The results are not entirely straightforward as the study also investigated several parameters of Vitamin D. I will try to extract what I regard as the most important points and integrate them with other studies.

The study was of 992 patients with Covid-19 admitted to hospital in Liverpool between March 18th and November 2nd 2020, early in the pandemic. Of these, 472 were studied in detail because following initial blood testing, there was sufficient surplus blood serum to allow retrospective blood testing for Vitamin D.

Vitamin D levels

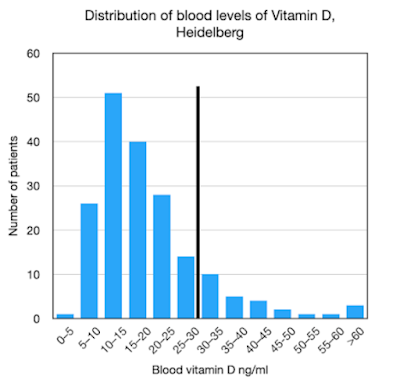
From the recent study from Israel, I find it compelling  that Vitamin D deficiency should be defined as less than 30ng/ml, 75 nmol/L. Less than this blood level indicates a high risk of severe or critical Covid-19, whereas above this level can be regarded as a safe range. In the study from Israel about 50% were deficient by this definition, and in a study from Heidelberg, Germany, in 2020 the proportion deficient of Vitamin D in was much higher at about 80%, in Figure 1.

Figure 1. Vitamin D in patients with Covid-19, 2020

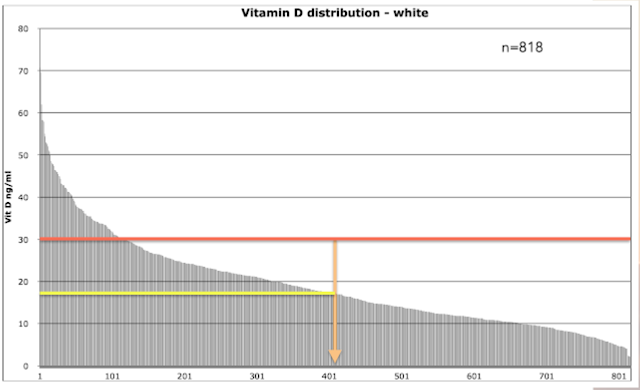
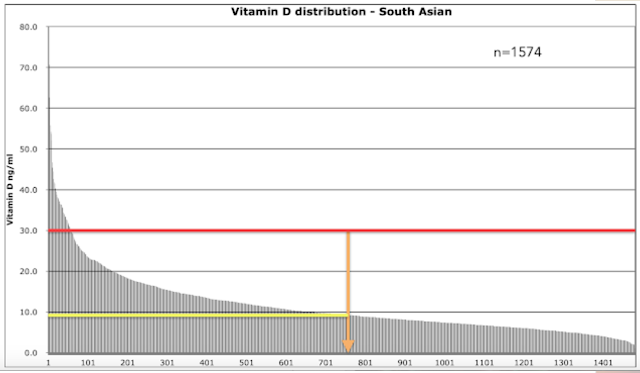
In my personal research in Blackburn, UK, 20 years ago the proportion with Vitamin D deficiency as defined above using the Israel data, was 682 in the ethnic white sample of 818 (83%), and a very disturbing 1514 in the ethnic South Asian group of 1574 (96%). 

I have shown this data previously, but as it was two years ago I will display the bar-charts below. Each vertical bar represents the blood vitamin D level of one person. As the distribution is not "normal" or symmetrical, the median is shown. This is the halfway point, 50% of the subjects below or above this level, the vertical orange line. The horizontal yellow line indicates the blood level of the median. The horizontal red line indicates blood vitamin D level of 30ng/ml, 75nmol/L and we can immediately see how few of the subjects were above this safe line.

Figure 2. Distribution of blood level of Vitamin D in 818 ethnic white people


Figure 3. Distribution of blood level of Vitamin D in 1574 ethnic South Asian people

In the ethnic white group the median blood level of Vitamin D is 18ng/ml, 45nmol/L.
In the ethnic South Asian group he median blood level of Vitamin D is 9ng/ml, 22.5nmol/L.

Liverpool experience

Once again we have the problem of two units of measurement of Vitamin D in current use. The paper from Liverpool uses the unit "nmol/L". I will express both even though this might appear cumbersome. 1ng/ml = 2.5nmol/L

The Liverpool study regarded 20ng/ml, 50nmol/L as being the lower limit of the ideal range, and therefore below this to be VItamin D deficiency. However the study from Israel indicated that 30ng/ml, 75 nmol/L would better be regarded as the lower limit of the safe range, based on biological advantage.

Of the 472 Covid-19 patients studied in Liverpool, we can see in Figure 4 the numbers with various blood vitamin D levels.

Figure 4. Distribution of Vitamin D in 472 Covid-19 patients


83% were deficient of Vitamin D with blood levels less than 30ng/ml, 75nmol/L. 
96% had sub-optimal blood levels of less than 40ng/ml, 100ng/L. 
These results indicate a serious but reversible public health problem.

We can see that in these 472 Covid-19 patients, there is an asymmetrical distribution, and so once again an arithmetic mean is not of particular value. The distribution is skewed to the lower range of blood levels of Vitamin D and the median, the middle of the range, was expressed in the study report. 

The proportion with suboptimal levels (as defined by high illness incidence) is the most useful way of expressing Vitamin D status of a population.

The pattern is similar to but not quite as dramatic as the Heidelberg study ahown in Figure 1. In this, there are more sub-divisions of Vitamin D level than in Figure 4.
 

Deaths

Of the 472 Covid-19 patients, 112 died within 28 days, 23.7% overall, 28% in men, 23.5% in women. This proportion of deaths was the general experience during 2020, when the highly vulnerable members of the population died.

Of those who died:

Average (median) blood level of vitamin D was 15.8ng/ml, 39.5nmol/L.

Of those who survived:

Average (median) blood level of vitamin D was 17.3ng/ml, 43nmol/L.

Those who survived had on average a slightly higher blood vitamin D level than those who died, in keeping with other studies, but the difference was not dramatic. The difference did not achieve "statistical significance", meaning that it could have been a chance finding. Whether or not there is clinical significance is a matter of judgement, a balance of potential benefits and risks of using or not using Vitamin D in clinical practice.

Statistical significance is influenced to a major extent in sample size. In investigating the effect of Vitamin D in Covid-19, it is operationally difficult to use a large sample size, unlike a pharmaceutical trial in a sample of normal people in the community.

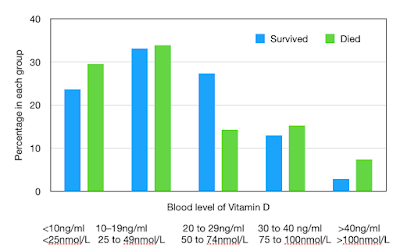
More detail is shown in Figure 5. Look at it carefully to see which green columns (died) were higher than the blue (survived).

Figure 5. Covid-19 survival or death and Vitamin D

We can see that the chance of death is greatest in those with the lowest blood levels of VItamin D, but also in those with the highest. 

Severe disease

The infuence of Vitamin D on severe Covid-19 was expressed as Odds Ratio, the relative chance of developing severe Covid-19 based on blood level of Vitamin D. The reference was a blood level of 20–30ng/ml, 50–74 nmol/L, as considered to be middle of the range found in the general population.

The odds ratio for severe disease:

for Vitamin D 20–30ng/ml, 50–74 nmol/L OR=1 (reference)

for Vitamin D <10ng/ml, <25nmol/L OR=2.37

There is no surprise here: severe disease is much more likely in those with the the very low blood levels of VItamin D, less than 10ng/ml, 25nmol/L.

The study therefore identified something expected. But there is more to consider.

High blood VItamin D

There were 18 patients with Vitamin D greater than 40ng/ml, 100nmol/L. For these the odds ratio of severe Covid-19 was high, with OR=4.65. This was an unexpected finding.

We know about Vitamin D "intoxication", hypervitaminosis D, in which excess Vitamin D causes an increase in the amount of calcium in the blood and in the urine. This can occur only with very high blood levels of Vitamin D, greater than about 200ng/ml, 500nmol/L.

But in this study there was no hypervitaminosis D, as judged by high calcium level in the blood, but we do see a disadvantage of a blood Vitamin D level just greater than 40ng/ml, 100nmol/L.

The report is of quadruple (OR=4.65) the risk of severe Covid-19 in this group with Vitamin D level >40ng/ml, 100nmol/L compared to the reference range of 20–30ng/ml, 50–74 nmol/L.

An explanation

This finding came as a surprise to me as this result has not appeared in other studies. Is it just a chance finding, a sort of mistake? All findings need to be replicated before they are generally accepted, or there must be a plausible mechanism, some connection that makes sense. But initial findings such as this must not be dismissed.

The paper from the study looked into a plausible explanation. 

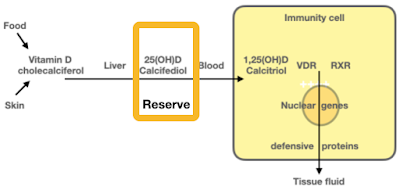
We must remember that Vitamin D produced in the skin or taken by mouth must be converted in the liver into 25(OH)D, the form which it circulates in the blood. 

In response to infection and to enable immune response, 25(OH)D is taken up by the immunity cells and is activated into 1,25(OH)D, which then unlocks VDR. A molecule of 1,25(OH)D can be used only once, and then it is converted into the inactive 24,25(OH)D.


25(OH)D is converted into the active 1,25(OH)D by the enzyme 1-alpha hydroxylase. Now, it appears that when the blood level of 25(OH)D increases above 40ng/ml, 100nmol/L, "Fibroblast Growth Factor 23" (FGF23) is induced, and this leads to the suppression of the enzyme 1-alpha hydroxylase. Activation of 25(OH)D to 1,25(OH)D will thereby be suppressed, and as a result there will be a diminished immune response.

This is a perfect example of the interaction of enzyme systems,  feedback control mechanisms, that became essential in evolution. The inactivation of 1,25(OH)D to 24,25(OH)D is an excellent example of an essential control system, and the suppression of the enzyme 1-alpha hydroxylase would be another.

Free and bio-available Vitamin D

Other Vitamin D parameters were investigated in the Liverpool study. When we assess blood levels of Vitamin D we measure it in its form that has been processed in the liver, 25(OH)D (also known as calcidiol or calcifediol). This is carried in the blood as a reserve, ready for use as and when necessary. In the blood it is bound to a specific Vitamin D Binding Protein (DBP), the amount of which can vary from person to person. This is because DBP is genetically determined, and the gene penetration is variable, determined by genetic polymorphisms, differences. The vast majority of 25(OH)D is bound to DBP and only 0.03% of it "free", unbound. Did this make a difference? 

This was investigated  and it was found that there was no relationship between DBP, and free D with mortality. Measuring 25(OH)D seems to be a satisfactory way to assess Vitamin D status.

Conclusion


The pandemic of Covid-19 has given huge research opportunity to investigate the optimisation of natural defensive immunity, with the role of Vitamin D based on extensive research during the previous forty years. 


Taking together the Israel and Liverpool studies, we can conclude that to minimise severe or fatal Covid-19 it is necessary for the blood level of Vitamin D to be between 30ng/ml, 75nmol/L and 40ng/ml, 100nmol/L.


It is clear that it is necessary to monitor regularly the blood level of Vitamin D so as to determine the optimal dose. 


We must monitor the blood parameters when correcting Vitamin D deficiency just as we monitor blood parameters when we treat diabetes and thyroid disorders.


I have noted many Comments. I have attempted to reply to them, but unfortunately, and for reasons that I do not understand, my replies do not attach. Sorry about this.